To actually demonstrate this point of view, we recently embarked upon a numerical experiment to run an implicit large eddy simulation (ILES) of the NASA CRM high-lift configuration from the 3rd AIAA High-Lift Prediction Workshop. The flow conditions are: Mach = 0.2, Reynolds number = 3.26 million based on the mean aerodynamic chord, and the angle of attack = 16 degrees.
A quadratic (Q2) mesh was generated by Dr. Steve Karman of Pointwise, and is shown in Figure 1.


Figure 1. Quadratic mesh for the NASA CRM high-lift configuration (generated by Pointwise)
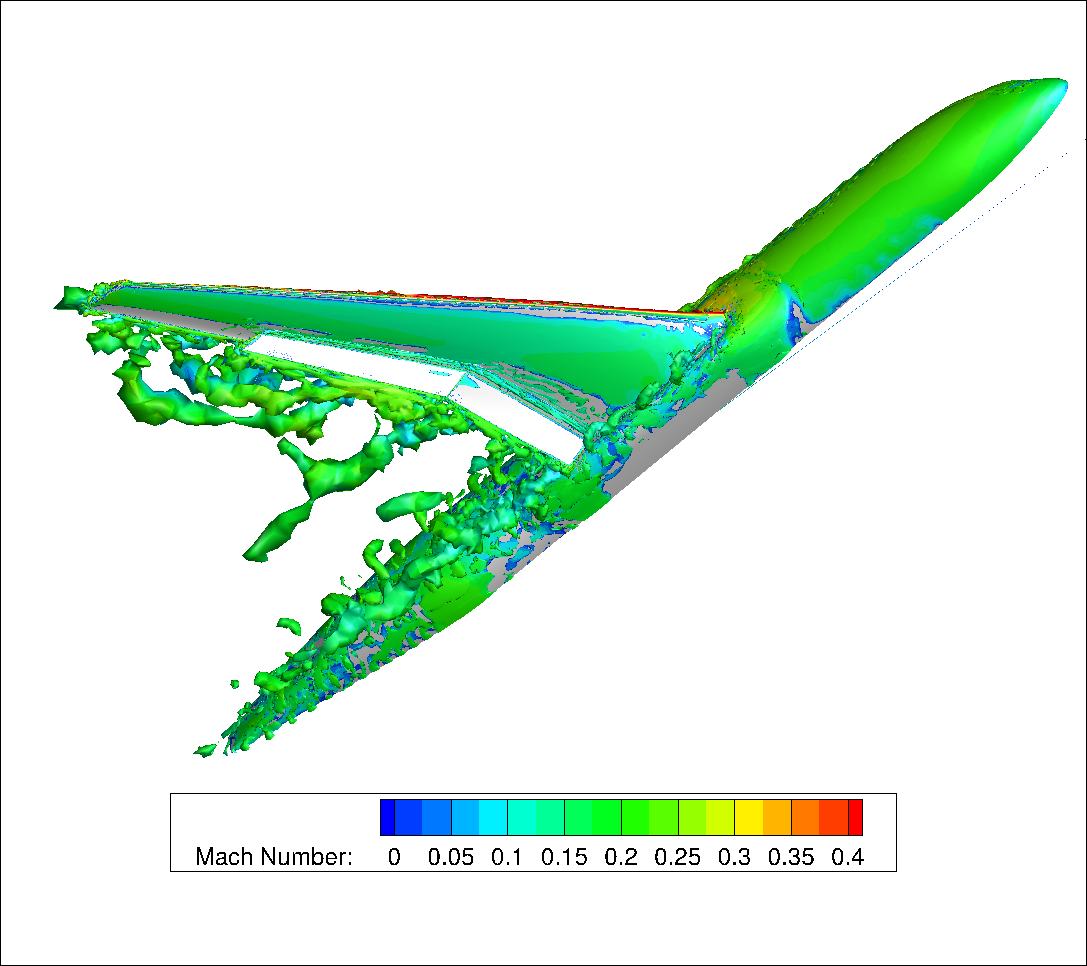
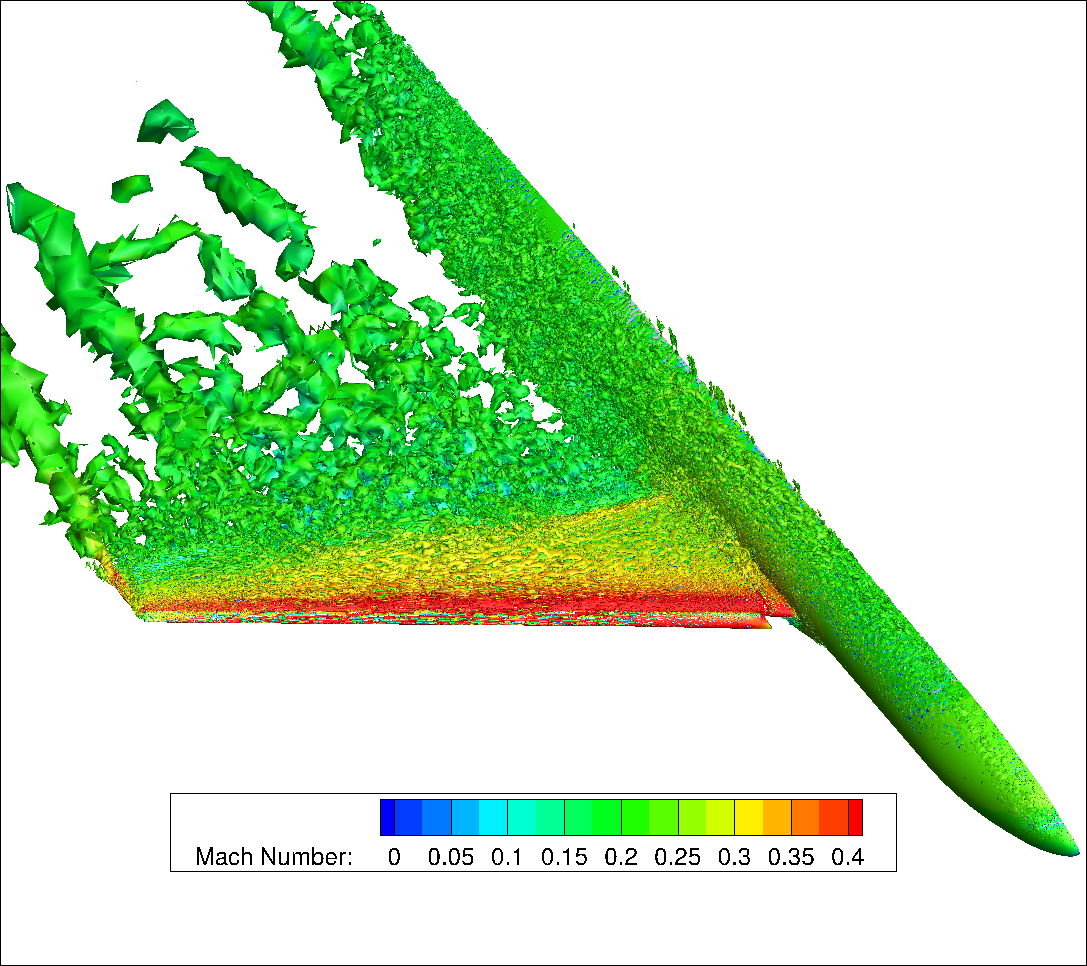
The mesh has roughly 2.2 million mixed elements, and is highly clustered near the wall with an average equivalent y+ value smaller than one. A p-refinement study was conducted to assess the mesh sensitivity using our high-order LES tool based on the FR/CPR method, hpMusic. Simulations were performed with solution polynomial degrees of p = 1, 2 and 3, corresponding to 2nd, 3rd and 4th orders in accuracy respectively. No wall-model was used. Needless to say, the higher order simulations captured finer turbulence scales, as shown in Figure 2, which displays the iso-surfaces of the Q-criteria colored by the Mach number.
  |
| p = 1 |
  |
| p = 2 |
  |
| p = 3 |
Figure 2. Iso-surfaces of the Q-criteria colored by the Mach number
Clearly the flow is mostly laminar on the pressure side, and transitional/turbulent on the suction side of the main wing and the flap. Although the p = 1 simulation captured the least scales, it still correctly identified the laminar and turbulent regions.
The drag and lift coefficients from the present p-refinement study are compared with experimental data from NASA in Table I. Although the 2nd order results (p = 1) are quite different than those of higher orders, the 3rd and 4th order results are very close, demonstrating very good p-convergence in both the lift and drag coefficients. The lift agrees better with experimental data than the drag, bearing in mind that the experiment has wind tunnel wall effects, and other small instruments which are not present in the computational model.
Table I. Comparison of lift and drag coefficients with experimental data
CL
|
CD
|
|
p = 1
|
2.020
|
0.293
|
p = 2
|
2.411
|
0.282
|
p = 3
|
2.413
|
0.283
|
Experiment
|
2.479
|
0.252
|
This exercise seems to contradict the common sense logic stated in the beginning of this blog. So what happened? The answer is that in this high-lift configuration, the dominant force is due to pressure, rather than friction. In fact, 98.65% of the drag and 99.98% of the lift are due to the pressure force. For such flow problems, running a LES on a RANS mesh (with sufficient accuracy) may produce reasonable predictions in drag and lift. More studies are needed to draw any definite conclusion. We would like to hear from you if you have done something similar.
This study will be presented in the forthcoming AIAA SciTech conference, to be held on January 6th to 10th, 2020 in Orlando, Florida.
It essentially shows that the drag (or lift) due directly to viscosity term is not the most important but the way that turbulence is generated on the wall and spread in the core flow is more important to capture. As the prediction versus mesh refinement seems to attain an asymptot without reaching experimental data, it seems that the default may come from LES / sublayer transition model.
ReplyDeleteSincerely yours
Hello, as a newbie to cryptocurrency trading, I lost a lot of money trying to navigate the market on my own, then in my search for a genuine and trusted trader/broker, i came across Trader Bernie Doran who guided and helped me retrieve my lost cryptocurrencies and I made so much profit up to the tune of $60,000. I made my first investment with $2,000 and got a ROI profit of $25,000 in less than 2 week. You can contact this expert trader Mr Bernie Doran via Gmail : BERNIEDORANSIGNALS@GMAIL.COM and be ready to share your own, tell him you were referred by me
DeleteThe drag and lift coefficients from the present p-refinement study are compared with experimental data from NASA in Table I. Although the 2nd order results (p = 1) are quite different than those of higher orders, the 3rd and 4th order results are very close, demonstrating very good p-convergence in both the lift and drag coefficients. The lift agrees better with experimental data than the drag, bearing in mind that the experiment has wind tunnel wall effects, and other small instruments which are not present in the computational model.
There seems to be no difference between P=2 and P=3. Is the mesh linear?
ReplyDelete